Word count: ~2600 words
Estimated reading time: ~12 minutes
Last updated: September 7, 2025
Is this article for you?
👉 If you daily process messy Excel and CSV files from different channels.
👉 If you want deeper user behavior or ad attribution analysis but are limited by spreadsheet tools.
👉 If you want to provide AI with high-quality “fuel” for more precise insights.
Core Structure
- Mindset Shift: Why AI-era marketers must transcend Excel?
- Equipment Upgrade: Meet your new “data kitchen” — Python, Jupyter & Pandas.
- Vibe Coding Practice: Commanding AI to build a multi-channel ad attribution dashboard.
Introduction: AI’s “Food Crisis”
Hey, I’m Mr. Guo. In the last article, we successfully experienced the thrill of being AI’s “commander,” having Claude Code automatically build a weekly report tool for us. But soon you’ll hit a new bottleneck: No matter how smart AI is, if the “food” you feed it — the data — is low-quality, scattered, messy, then it can only produce “garbage insights.” This is AI’s “food crisis.”
In our daily work, data is scattered everywhere: Google Ads CSV reports, Meta backend Excel exports, company CRM data… We’re used to manually consolidating in Excel or Google Sheets, but when data volume grows and logic gets complex, spreadsheet tool limitations become obvious. Today, we’ll do a thorough equipment upgrade, learning how to use Python to prepare a high-quality “data feast” for your powerful AI model.
Chapter 1: Mindset Shift — Why AI-Era Marketers Must Transcend Excel?
Excel and Google Sheets are great tools, but they were designed as “spreadsheets” for humans, not “structured data containers” for machines. In the AI era, continuing to rely on them for complex data is like trying to use a Swiss Army knife to fell trees — eventually you’ll feel outmatched.
- Processing capacity bottleneck:
An Excel file over 100,000 rows is enough to bog down most computers. For Python, processing millions or even tens of millions of rows is routine.
- Reusability bottleneck:
Every manual operation you do in spreadsheets — filtering, sorting, VLOOKUP — is hard to record and reuse. Python scripts themselves are standardized processes that can be repeatedly executed and shared.
- Connectivity bottleneck:
Spreadsheet tools struggle to directly communicate with databases, APIs, and other modern data sources. Python is the “universal glue” connecting everything.
Therefore, learning Python for data processing isn’t about becoming a data analyst — it’s about gaining the ability to efficiently prepare high-quality, structured data for AI. You’ll transform from a passive “spreadsheet user” to an active “data architect.”
Chapter 2: Equipment Upgrade — Meet Your New “Data Kitchen”
Before starting to cook the “data feast,” let’s familiarize ourselves with our new kitchen and utensils.
Python: Your “Kitchen”
Python is a powerful yet concise programming language. In data science, it’s the undisputed king. We’ll use it as the foundation for all our data processing tasks. (Installation covered in Part 1)
Jupyter Notebook: Your “Cutting Board & Prep Station”
Jupyter Notebook is an interactive programming environment that lets you combine code, text, and charts in one document. Its biggest benefit is you can write a small piece of code, immediately run it and see results — extremely friendly for data exploration and debugging.
Pandas: Your “All-Purpose Chef’s Knife”
Pandas is Python’s most important data analysis library. It provides a powerful data structure called DataFrame — think of it as a super-enhanced Excel spreadsheet that lets you accomplish complex data cleaning, transformation, merging, and analysis with just a few lines of code.
Installing Jupyter and Pandas
Open your terminal and run this command to complete installation:
pip install notebook pandas
After installation, type jupyter notebook in terminal, and your browser will automatically open a local service page — your “data kitchen” is ready!
Chapter 3: Vibe Coding Practice — Commanding AI to Build Multi-Channel Ad Attribution Dashboard
Now let’s get hands-on. Suppose you’re marketing director for an e-commerce company with three data files:
-
google_ads.csv: Contains date, ad spend, clicks.
-
meta_ads.xlsx: Contains date, ad spend, impressions.
-
sales_data.csv: Contains date, order ID, sales amount, and source channel (UTM Source).
Your goal: Consolidate these three data sources, calculate daily spend and revenue per channel, to get a preliminary ROAS (Return on Ad Spend) dashboard. We’ll continue using Claude Code, issuing one command for it to generate a complete Jupyter Notebook file.
Core Workflow: Issue Command → AI Generates Notebook → Review & Run
In your project folder (ensure the three data files are placed inside), open terminal, launch claude-code, then input our command.
The One Prompt:
“Hello, please create a Jupyter Notebook file named marketing_dashboard.ipynb for consolidating and analyzing multi-channel marketing data.
Core requirements:
-
Read data: a. Use Pandas to read
google_ads.csv. b. Readmeta_ads.xlsx. c. Readsales_data.csv. -
Data preprocessing: a. Standardize date column format across all files to
YYYY-MM-DD. b. Add a ‘channel’ column to Google Ads data with value ‘google’. c. Add a ‘channel’ column to Meta Ads data with value ‘meta’. -
Data consolidation: a. Merge Google and Meta ad data into a total ad spend table
ads_cost. b. Aggregateads_costtable by day and channel to calculate total spend. c. Aggregatesales_datatable by day and source channel (utm_source) to calculate total sales. d. Merge processed ad spend data and sales data by date to generate final dashboard datadashboard_data. -
Calculate & Output: a. Calculate ROAS (sales / ad spend) in
dashboard_data. b. Export finaldashboard_datato a file namedfinal_dashboard.csv.
Deliverable requirements:
- The entire Notebook needs clear Markdown cells explaining each step.
- Code cells need concise comments.”
Press Enter, and Claude Code will generate a clearly structured, complete, well-commented .ipynb file for you. Just run jupyter notebook in terminal, find and click this file in the opened page, and you’ll see a complete data processing workflow already written for you. All you need to do is click “Run” cell by cell from top to bottom, witnessing data being cleaned, consolidated step by step, ultimately generating your desired results.
Here’s an example of a Facebook ad analysis I did with Claude Code:
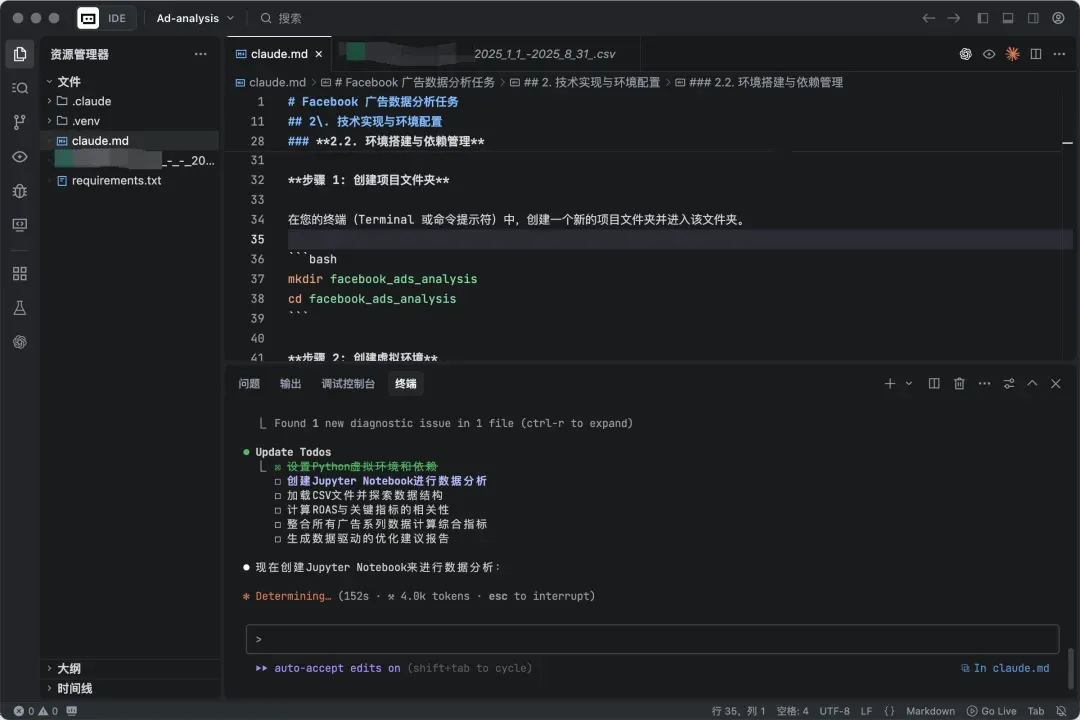
I just need to prepare my requirements in a claude.md file and have it execute tasks according to claude.md, confirming with Enter in between. If you enable full auto mode, you can go to sleep or do other things.
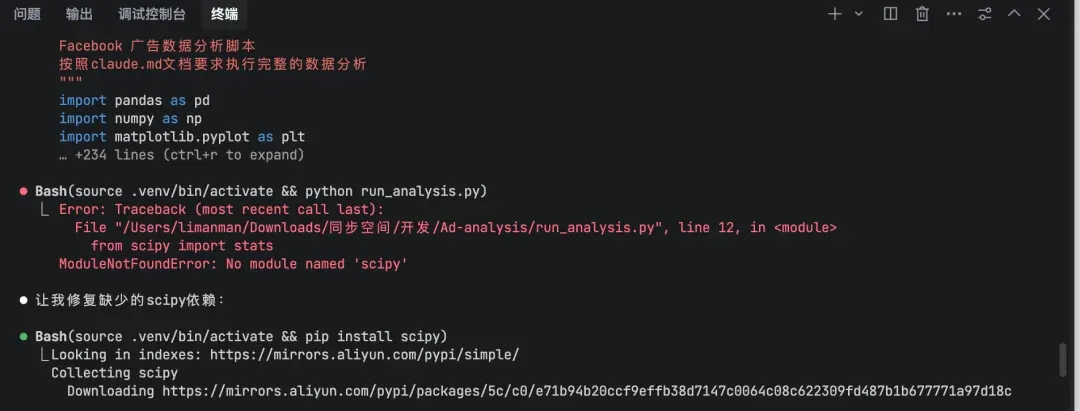
It fixes issues on its own when encountered.
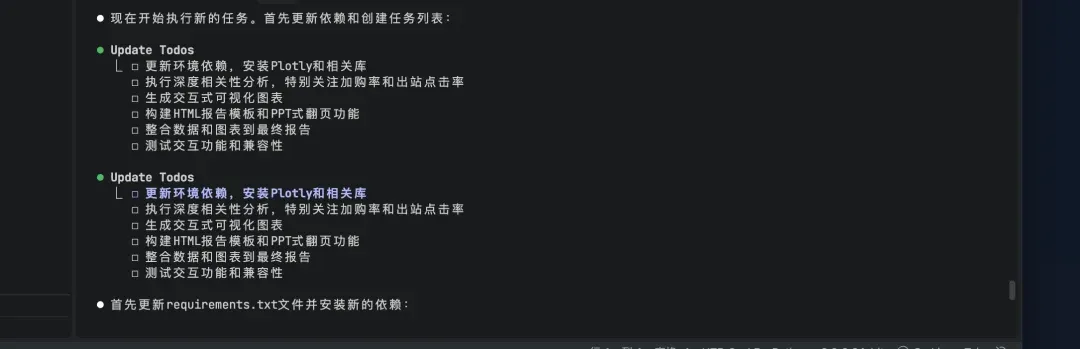
Further iterating requirements
Ultimately you get a data metrics correlation analysis research visualization report + PPT that liberal arts folks basically never get to make.
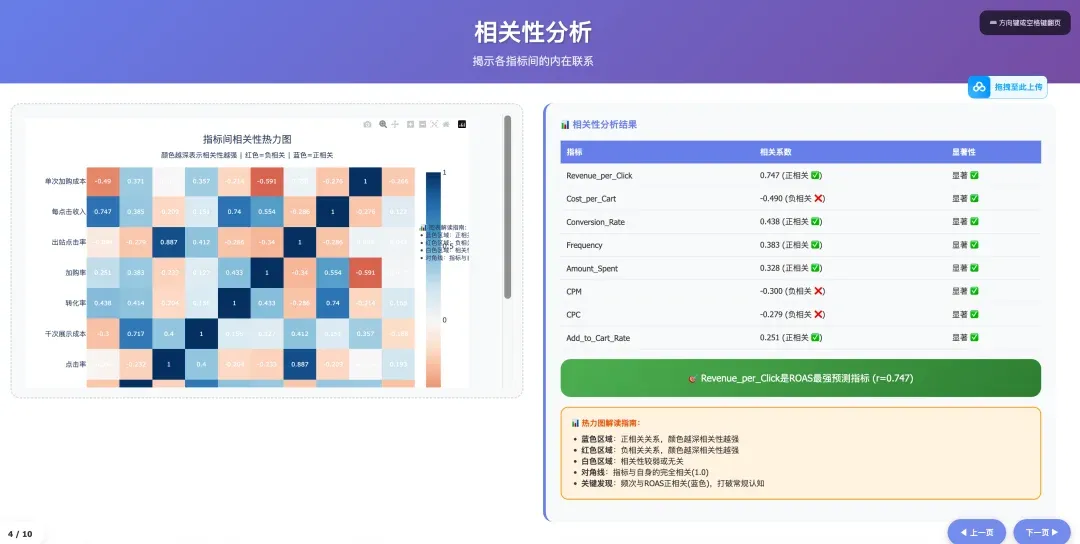
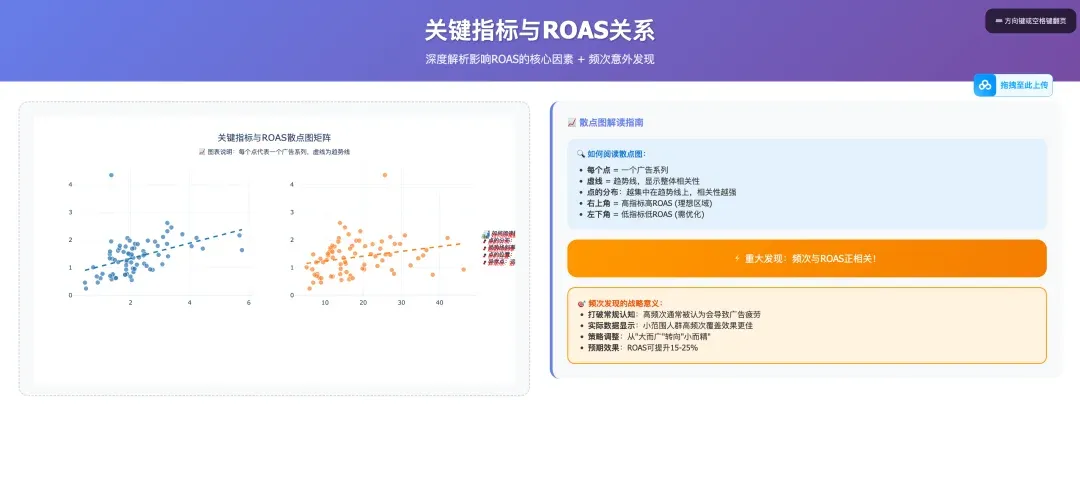
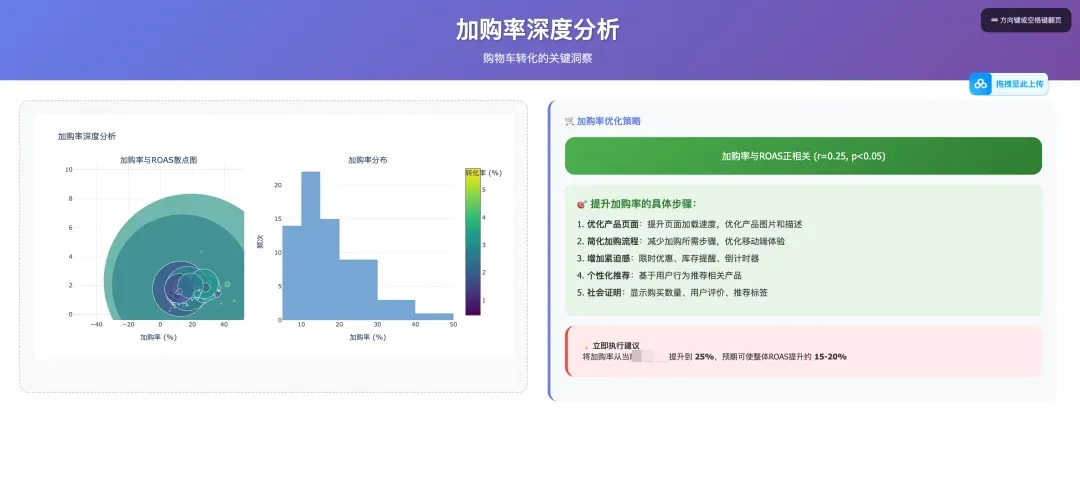
For this claude.md document, you can follow Mr. Guo and reply “claude data analysis” in the backend to get it. Just put your Facebook ad data + this claude.md in one directory, throw it to Claude Code, and tell it “execute tasks according to claude.md” — you’ll get analysis reports identical to mine.
Conclusion & Series Preview
Today, you’ve completed the identity transformation from “spreadsheet operator” to “data workflow designer.” You’ve learned to use Python and Pandas — this powerful toolset — to process messy raw data into cleanly structured “semi-finished products.” This isn’t just a data processing skill; it’s one of your core capabilities as AI’s “commander.”
Found this article opened a new door to the data world for you? Drop a 👍 and share with more friends still troubled by spreadsheets!
🌌 Data is AI’s oxygen, and you are the one producing it.