
This is an SEO case study. In mid-to-late July this year, I took over the website of a vertical learning app built for international markets. Before that, the site’s search traffic had been low for a long time, with no growth at all.
Three months later, the results looked like this: impressions over the last 28 days reached 176,957, 10.8 times the 16,413 of the first 28 days; clicks in the latest week reached 899, 3.1 times the 291 of the first week.
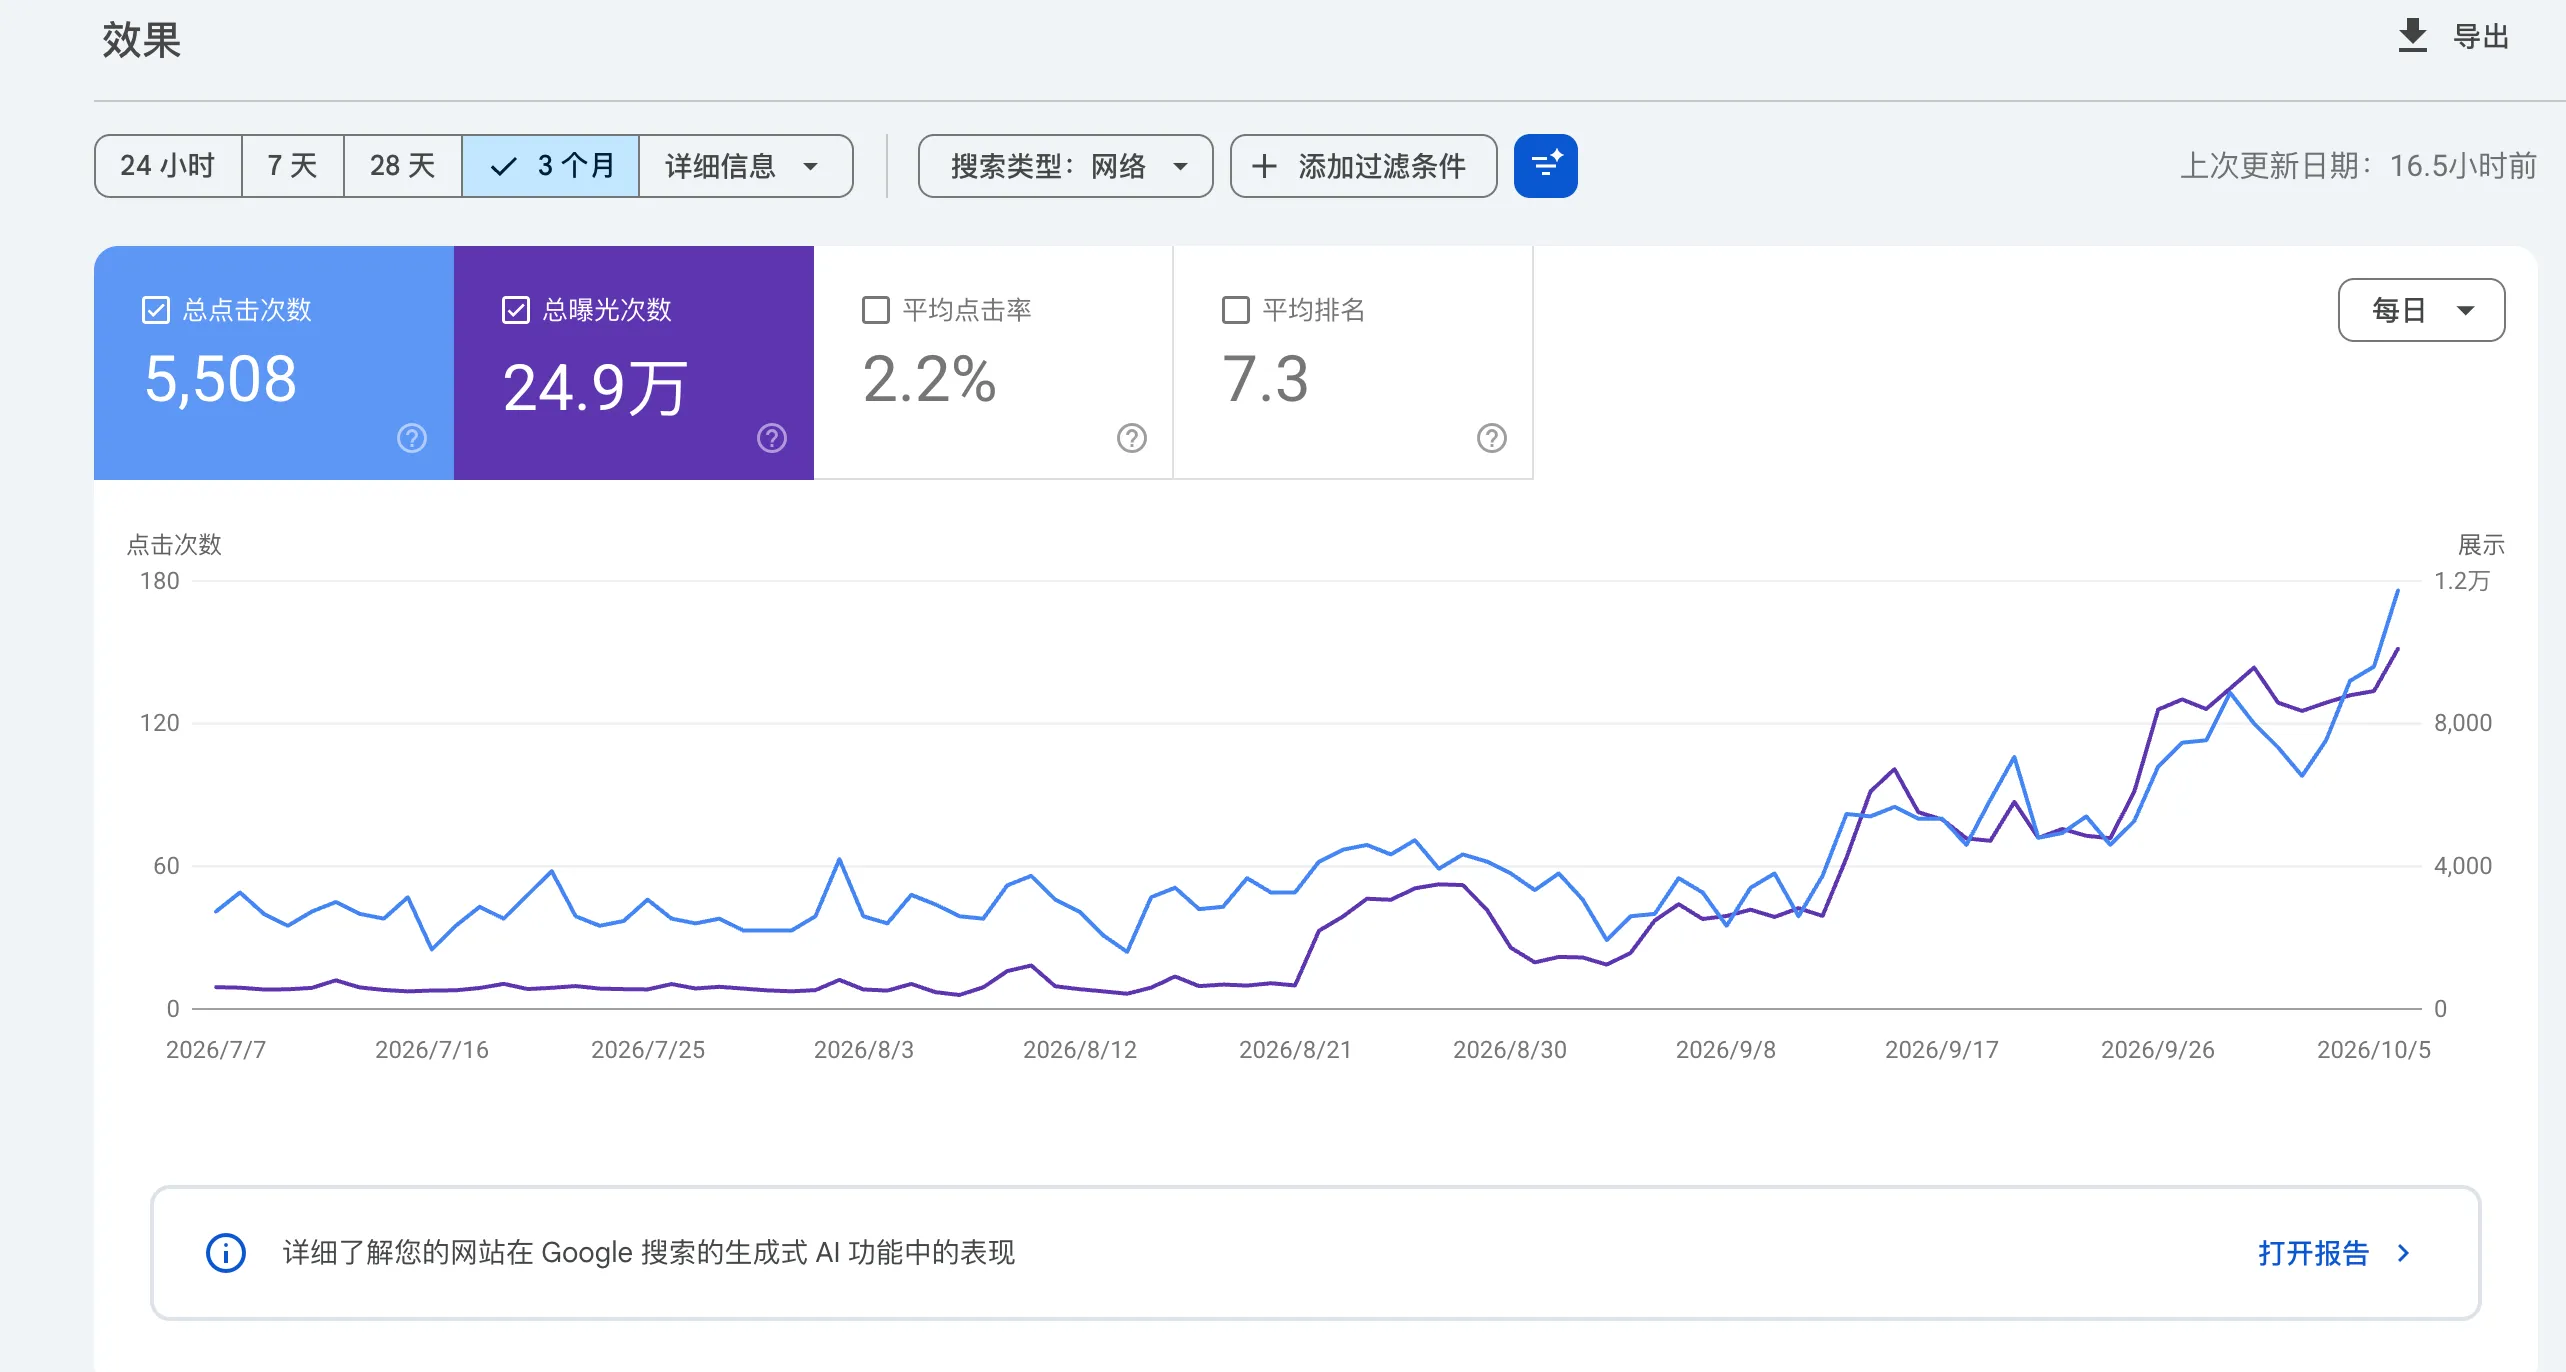
This chart is Google Search Console data from July 7 to October 6: 5,508 clicks and 249,000 impressions over the three months. On a weekly basis, impressions grew from 4,277 in the first week to 62,914 in the latest week, about 14.7 times. On clicks, the last 28 days brought 2,608, up 131% from 1,129 in the first 28 days, with the daily average rising from about 40 to 93. In the latest week, the daily average was already around 128.
To rule out the illusion created by a very low base, I also compared the last 28 days with the 28 days immediately before. Clicks were still up 85% and impressions up 256%. The growth is ongoing rather than stuck on a single step.
Below I break the three months down: how I made the call, what I actually did, which moves worked, and what comes next.
The Starting Point: A Site That Only Lived on Brand Searches
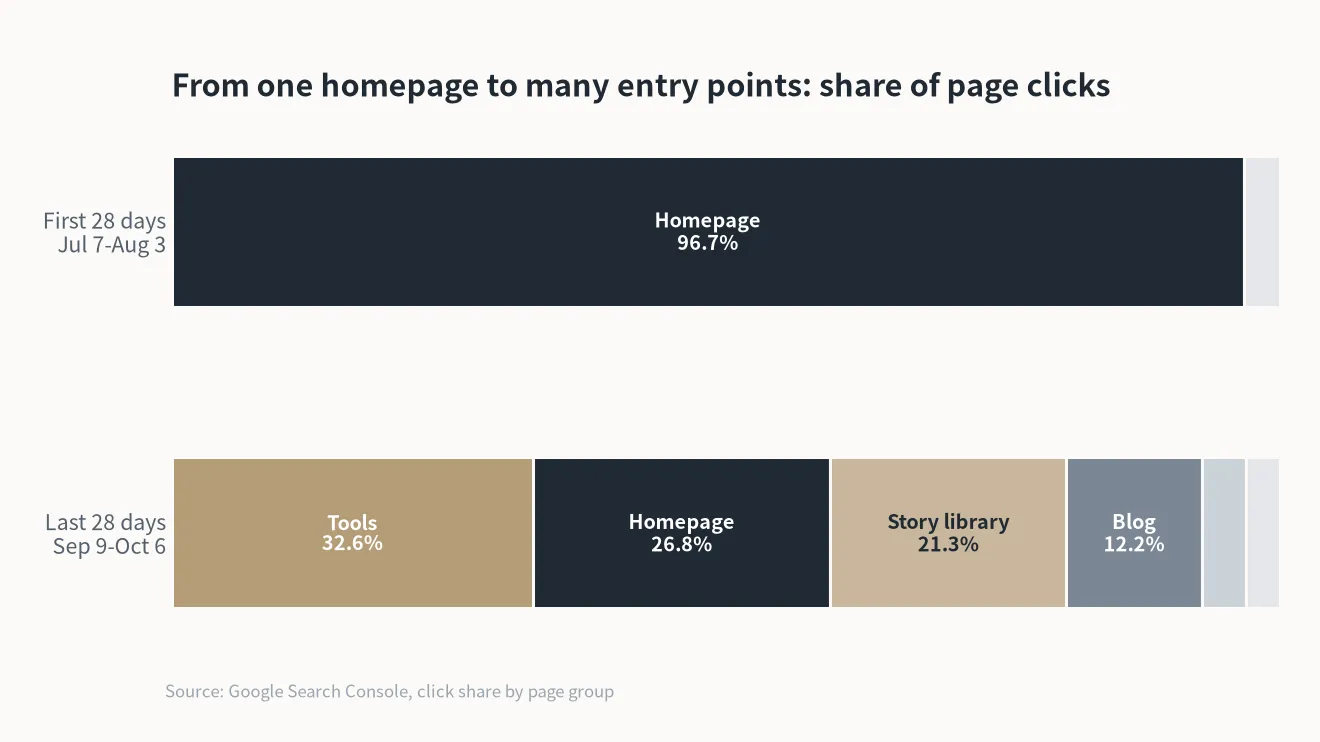
In the first 28 days, 96.7% of the site’s page clicks came from the homepage and its anchor links.
That number largely explains the long-term zero growth. In the search engine, the site had a single identity: the official website of this app. Almost everyone who arrived already knew the brand and searched for its name. Brand search volume depends on how well-known the product itself is, and no matter how good the homepage is, it can hardly make more people search for the brand name.
So the problem I had to solve was clear: let people who do not know the brand yet find their way in through search.
The July 23 Plan: Entering Search With Pages That Complete a Task
When taking over a low-traffic site, the usual first step is to write lots of articles. I did not put that on the main line. For a site without much history, the search results for broad explanatory content have long been occupied by large content sites, and a new site that pours in a lot of writing usually gets little back. This also continues what I have been doing for the past year or two: whatever content can be turned into a tool gets turned into a tool first.
The core of the plan I set on July 23 was to connect users’ search tasks with the product’s real usage tasks. A user searches for a specific problem, gets it done right on the web page, then has a reason to save, review, and keep using it, and eventually moves into the app.
The inputs for the plan included 30-plus seed keywords, more than two thousand US-market keyword records, the keywords and page structures of adjacent products, and a renewal-behavior report covering more than thirteen thousand users. On that basis, I set a few principles. Protect the existing brand homepage; new pages must not be built at its expense. Prioritize page types that let users complete a task, such as small tools, templates, and interactive quizzes. Let each search intent be served by one main page so that our own pages do not compete for the same keyword, with the homepage positioned as the brand entry from day one. Off-site, spread the product’s real workflows and earn credible citations.
I had already written up the cost of a homepage and a feature page competing for the same keyword in Making Money Going Global Is Great, Until Traffic Tanks. Here’s How to Save Yourself. In that case, the homepage and the tool landing page of an AI tool site cannibalized each other and traffic dropped noticeably. The page division this time took that lesson directly on board.
The plan was also revised as evidence came in. In the first draft I had the homepage go after a broad category keyword. After checking the real search results pages and existing rankings, v2 handed the homepage back to the brand, moved category demand to a dedicated feature page, and set a 6-to-8-week observation window. v3 then condensed these revisions into an actionable page list.
Execution Rhythm
I designed the plan and I carried it out. Over the three months, the site’s main branch received more than a hundred code commits.
From late July to early August I laid the foundation: blog migration, multilingual routing, sitemap and index governance, and monitoring. In early-to-mid August, tools, quizzes, download entry points, and how-to content went live. Late August added resource pages and data tracking. In September, a multilingual story content library launched, alongside app comparison and alternatives content; the off-site Guest Posts and directory submissions also landed mostly in this phase. Late September completed site-wide conversion-button tracking and internal linking.
Three Growth Steps
Looking back at the data, growth came in roughly three steps, each with a different main driver.
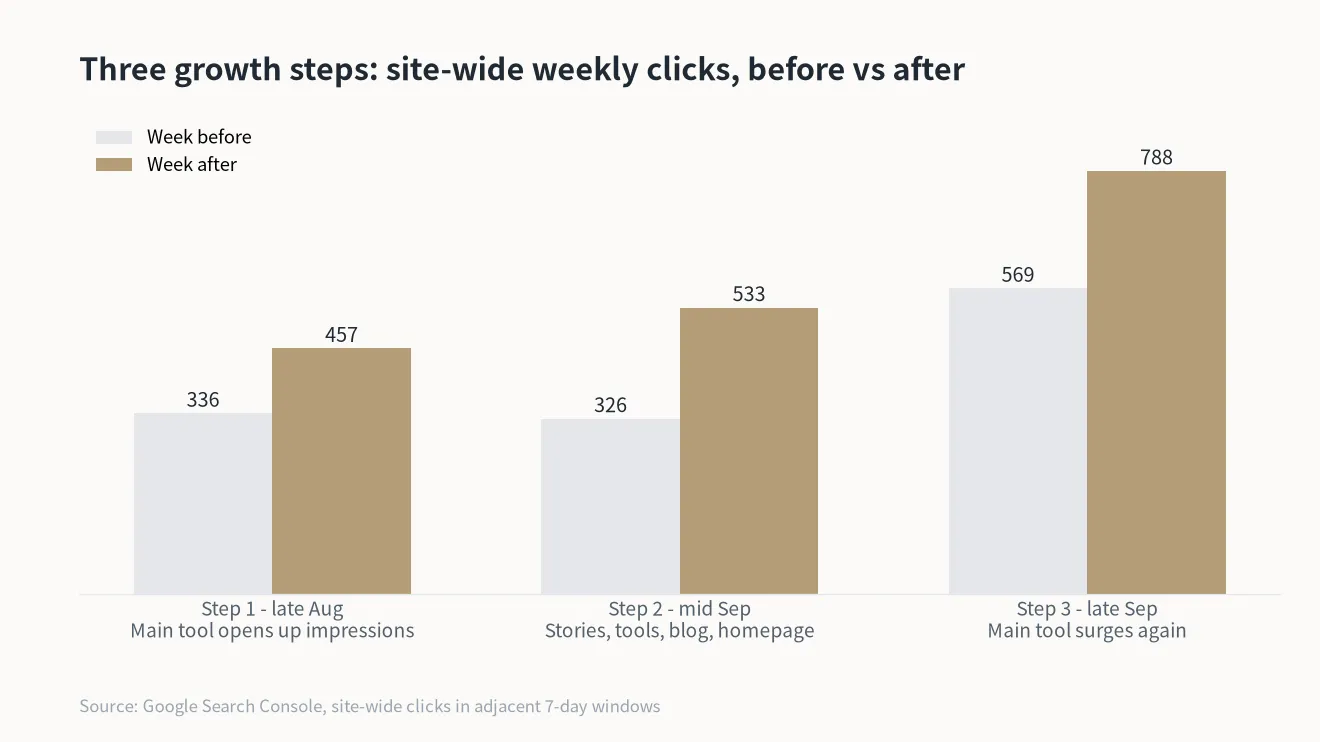
The first step came in late August. Comparing the two weeks before and after, site-wide clicks went from 336 to 457 and impressions jumped from 4,863 to 21,293. Within that, the tools group went from 17 to 163 clicks and from 536 to 16,779 impressions. The main tool, a lightweight “random content generator”, grew from 222 to 16,212 impressions on that single page, while homepage clicks over the same two weeks were 248 and 247, almost unchanged. The new growth came mainly from new entry points, and this was the first validation of the plan’s main hypothesis.
The second step came in mid-September and was a combined lift. Site-wide clicks went from 326 to 533 and impressions from 18,738 to 35,281. Story library clicks rose from 56 to 109, with the largest gain in impressions; tools, blog, and homepage rose at the same time.
The third step came in late September, when growth concentrated on the main tool again. Its weekly clicks went from 51 to 314, contributing 68.8% of the gain among all pages that grew, lifting site-wide weekly clicks from 569 to 788, while the average ranking of its core keyword improved from 7.83 to 5.48. I made no direct change to that tool that week; the most recent related change was on September 15. So the existing data cannot isolate which change triggered it.
What Worked Was a Small Number of Task Pages
Over the last 28 days, the tools group took 32.6% of the site’s clicks, 851 in total, from only about 13 URL rows in Search Console. The site’s existing course and video library has 701 URL rows and got just 49 clicks in the same period.
The two kinds of pages differ in age and search intent, so this is not a strict experiment, but it is enough to show that what decides a page’s ability to acquire users is whether it fulfills a specific task; page count by itself matters little. A “study plan generator” tool added later confirmed this too: it got 70 clicks in the last 28 days, and its core keyword ranking rose from 7.27 to 5.83.
The Second Engine: A Multilingual Content Library, With Spanish in the Lead
In the original plan, multilingual content was scheduled for 6 to 12 months out. In September I brought it forward, and the story library launched in batches in English, Spanish, and Portuguese.
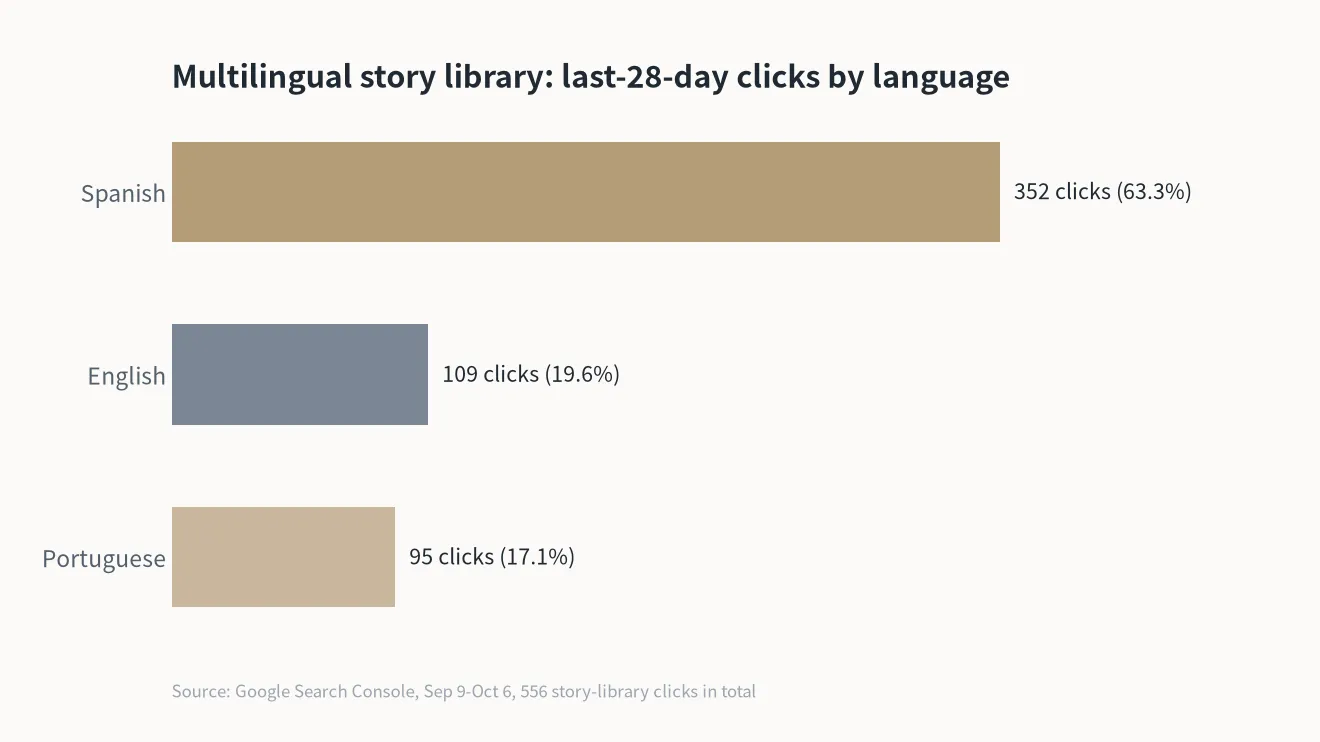
Over the last 28 days, the story library brought 556 clicks in total, 21.3% of the site, becoming the second entry point at scale after tools. By language, Spanish got 352, English 109, and Portuguese 95, so Spanish accounted for 63.3% of story library clicks. At least for this kind of content, the Spanish-language market offered a bigger opportunity than English, and it showed up first.
By country, from the first 28 days to the last 28 days, US clicks grew from 648 to 1,048, Brazil from 80 to 191, the UK from 8 to 92, and India from 15 to 129. Growth now covers multiple markets. Mobile clicks rose from 671 to 1,794, and their share from 59.4% to 68.8%.
Off-Site Optimization: Guest Posts and Directory Submissions
Alongside the on-site work, I did not let off-site optimization slide. Over these three months, off-site work came down to two things.
The first was a wave of Guest Posts built around product workflows. The topics all focused on what users actually get done with the product, such as the use cases and limits of AI-assisted learning, and how to turn a single piece of input into study material that can be reviewed, with links pointing to the relevant product pages and comparison guides. Five of them are published and publicly verifiable so far, spread across five tech media sites.
The second was a batch of automated submissions to directory and navigation sites, placing the official site and product information on relevant directory-style sites to widen the brand’s external discoverability.
By Semrush’s measure, the site’s backlinks grew from 153 in July to 1,288 now, and referring domains from 27 to 172, about 8.4 and 6.4 times the original numbers respectively.
Beyond the content we placed, natural citations also appeared. An education organization’s resource page cited the product in a study guide, a personal blog post linked directly to the main tool, and several users and communities keep sharing content created with the product on their own blogs.
Traffic paid off as well. From September 22 to October 6, five media sources brought 20 sessions, 18 of them engaged, and one download click. Social channels brought another 49 sessions, many landing on user share pages. ChatGPT brought 5 sessions and one download click, an early signal from the AI entry point.
How much the off-site work contributed to Google search growth will take longer data to observe. What is certain is that the product has started to appear in third-party content in the form of real workflows, which lays the groundwork for brand trust and AI search citations going forward.
Early Conversion Signals
Tracking for the download button and QR code was completed on September 21. From September 22 to October 6, organic search brought 332 sessions; 66 users clicked the download button 98 times, and 20 users opened the download QR code 57 times on desktop.
These are signals of download intent; the corresponding installs and later usage still need app-side data to confirm. At present, 70.4% of download clicks happen on the homepage, and new users arriving through tools and content pages still need a more natural path into the product.
What I Got Right, and What to Systematize Next Time
Looking back, three things were decisive: following the idea of turning content into tools and choosing task-completing page types as the entry point, protecting the brand homepage’s base, and letting the plan adjust to evidence from the search results pages. Bringing multilingual content forward gave the site a second growth route; the off-site Guest Posts and directory submissions grew backlinks and referring domains significantly over the three months, and the product began to be genuinely discussed by third parties.
Next time I will make a few things more systematic. The plan should go from one big list to an asset portfolio with validation windows, with each topic stating its hypothesis, baseline, cost, observation period, and the conditions to scale up or stop. Priorities should be set by four factors together: whether the page lets users complete a task, whether the search results page leaves room for a new site, whether the task naturally hands off to the product, and the real data from the first few weeks after launch. A broad quiz topic planned at large scale based on search volume got just one click in the last 28 days, which is a very direct reminder. Measurement should also come before launch. The main assets were already getting traffic in August, but download tracking was not completed until late September, and the conversion data for that stretch can no longer be recovered.
Next Steps
First, lock in baselines for the current winners: track the main tool and the study plan tool weekly by page, core keyword, device, and country. The main tool currently accounts for 81.6% of the tools group’s clicks, so a second and third stable entry point need to be built soon.
Then, design a real “save / continue” action on the tool result page so users have a concrete reason to move into the app after completing a task, and connect search, web, and app data to the same cohort of users to validate installs, retention, and payment. Off-site, keep doing Guest Posts around real workflows, and set up a landing-page and traffic log for every source. Expand multilingual content only into the languages and topics that already show signal.
Finally, a Few of My Views on SEO
Over three months, the site’s 28-day impressions grew to 10.8 times and weekly clicks to 3.1 times the starting level; the homepage’s share of page clicks fell from 96.7% to 26.8%, and user acquisition moved from a single brand homepage to tools, multilingual content, and the homepage together. The call to enter search with task pages has been fairly well validated. How many of these new users will stay with the product is the question for the next stage.
Looking back, there are a few SEO views behind this growth that I have held for a long time.
In this project, pure blog content was not the first priority. That choice goes back a long way for me. Starting a little over a year ago, I began exploring “turning content into tools” and “turning tools into content”: taking things that used to need a whole article to explain and making them into tools users can operate directly and get results from on the spot, and in the other direction, letting tool pages carry enough content and meaning for search engines to understand and index them. Between late July and early September 2025, I built a set of prototypes along these lines, turning a landing-page methodology, a programmatic SEO tutorial, a brand growth framework, and an ad data analysis case into interactive tools that generate page matrices and copy, scenarios and databases, user personas and go-global strategies, and analysis plans and optimization suggestions. I believe this interactive-content thinking puts me fairly early among my peers.
In March this year, in Maybe “Growth Engineer” Is the Best Career Path for Front-End Developers (in Chinese), I talked about combining content, marketing, and technology into resource sites and automated growth systems. My late-July piece, Stop Asking Codex to Write 100 Articles: The Most Valuable SEO Work on a Mature Site Is Managing Existing Content, was more specific: if content needs a comparison table, a selector, a calculator, or an FAQ component, it can be built and verified directly in the same code repository, without waiting two weeks for a development slot. I also set a boundary in that article: “A beautiful interactive module that does not solve a real task only adds JavaScript and maintenance cost to the page.” Both pieces rest on the same judgment: publishing volume alone does not move SEO; pages that help users complete tasks do.
Outside the first priority, the blog remains core ground. Articles with commercial intent convert strongly and must be run as core pages, and “Best” list articles are the typical example. In this project, one core Best list article brought 43 clicks in the last 28 days, capturing a set of related long-tail searches; blog article pages together brought 318 clicks, 12.2% of the site. On October 8, another 20 app guides of the same kind went live, and they will be evaluated separately in the next observation window.
Moving the blog back in line is about freeing resources for tools and interactivity. In the AI era the cost of writing code keeps falling. Interactions and animations that used to take a front-end team weeks can now be built almost on the fly, so we can be much bolder with interaction and motion. But that boldness itself needs restraint. The more interaction and animation a page has, the more computing resources it consumes and the more pressure it puts on Core Web Vitals, which ultimately hurts loading experience and the ranking foundation. Before adding any interaction, I first make sure it actually helps users complete their task faster.
In the end, the underlying DNA of SEO has never changed: a good user experience, and truly meeting users’ search intent and needs. Only the means have changed, from articles and templates to tools, quizzes, and multilingual content, with more choices than ever. The means will keep changing; this baseline is one I will keep holding.
If you’re interested in AI going global, SEO and more, feel free to reach out to Mr. Guo anytime.
